For our final project in GIS5999, we were encouraged to come up with our own project and use many of the tools we've learned over the last year.
For many decades the first colonizers of the Americas were a group of people called the Clovis tradition. This has been challenged in recent years by sites that are as old or older than known Clovis sites. Recently, the Western Stemmed Tradition culture (refers to a style of lithic point) has been found to be as old or older than Clovis. I was able to acquire the database of WST points for the Oregon Burns District of the Bureau of Land Management. I've worked at a site in this district for the last couple summers and thought it would be interesting to expand upon this work. Map 1 shows the distribution of known WST artifacts across the Burns District.
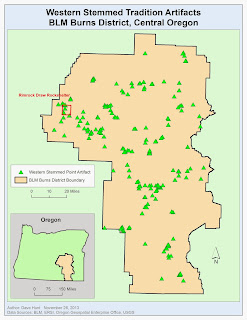 |
| Map 1 |
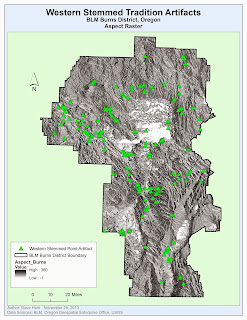
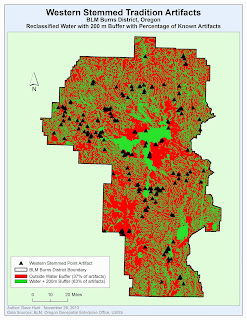
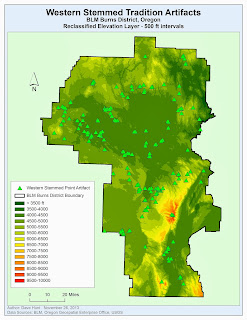
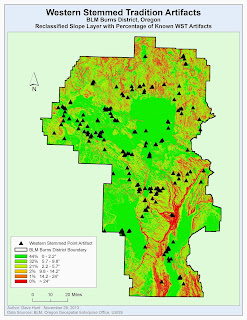
My project involves creating a predictive model. A predictive model should help archaeologists plan future surveys by highlighting areas that are likely to produce more sites and save time by avoiding areas with low probability of producing sites. My model will use proximity to water, elevation, slope, and aspect (direction towards the sun) to produce the predictive model. Map 2 shows all the water features (lakes and streams) in the district with a 200 meter exterior buffer. Map 3 shows the elevation model for the district. Map 4 is a slope raster produced from the DEM. And, Map 5 is an aspect raster also produced from the DEM.
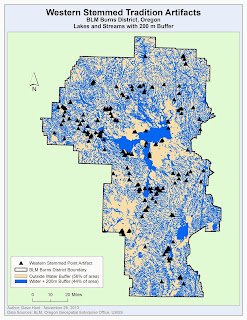 |
| Map 2 |
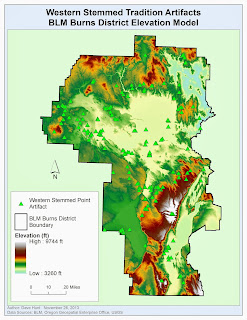 |
| Map 3 |
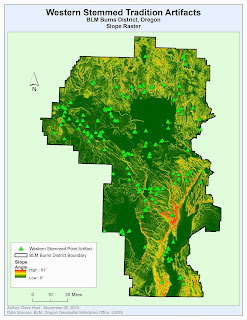 |
| Map 4 |
 |
| Map 5 |
For this predictive model, I had the advantage of having the database of locations for 414 known WST artifacts. Using this information, I was able to use an ArcMap tool (Extract Values to Points) to determine how artifacts were grouped within each component. For example, for elevation, I created a layer divided into intervals of 500 feet each (i.e., 4000 - 4500, 4500 - 5000, etc.). Then, using the Extract Values to Points tool, I could determine how many artifacts fell into which interval. From this information, I could determine the percentage of artifacts in each class and Reclassify the raster to hold that value. Map 6 is the water buffer map reclassified to show that 63% of artifacts occur within 200m of water while 37% of artifacts occur outside that buffer. Map 7 is the reclassified elevation map, showing that most WST artifacts occur between 4000 and 5500 feet. Map 8 is the reclassified slope map, showing that most WST artifacts occur on flatter terrain. Map 9 is the reclassified slope map showing that, surprisingly, most WST artifacts occur in a Northerly aspect.
 |
| Map 6 |
 |
| Map 7 |
 |
| Map 8 |
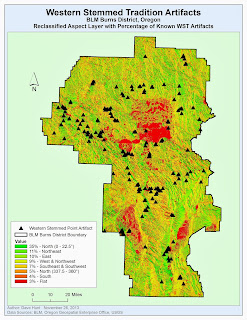 |
| Map 9 |
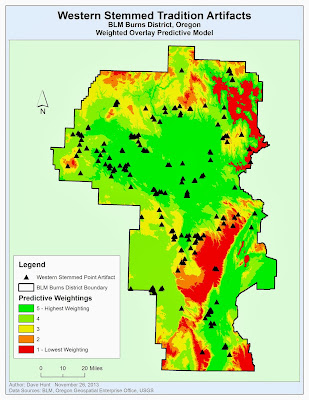
The Weighted Overlay tool in ArcMap allows us to assign relative values then to each of these rasters and combine them, based on that value and the reclassified values within them, into a single "weighted" raster. This combination should provide a whole, more useful than its parts, that can be used to determine which areas are more likely to yield further WST sites. Map 10 is the final weighted overlay from this analysis. Green areas a good areas to conduct further survey research, red are likely poor areas.
 |
| Map 10 |
Overall, I was a little disappointed with the generalized look of this predictive model. In the future, I would like to refine it and hopefully tighten up the areas that are most highly weighted.
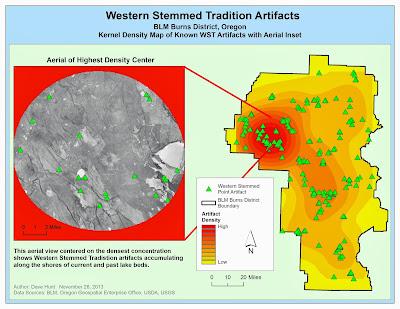
In addition to the weighted overlay, I was curious about producing a density map based on known WST artifacts. This is shown in Map 11. This map also includes an aerial image of the center of the densest region. Looking at the aerial, we can see that, in fact, many of the artifacts in this densest region are on the shores of dry lakes. One area that might help tighten the predictive model is to just use the lakes features and exclude streams. Streams (and 200m buffers around them) consume an enormous area of the map and perhaps WST people were more inclined to live along lake shores than stream banks. This is an area I will research further.
 |
| Map 11 |
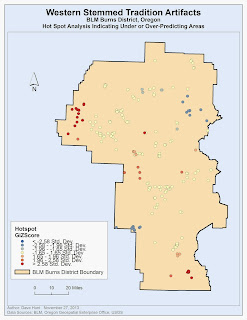
Finally, for the graduate student requirement, we conducted some statistical tests on our results. Map 12 shows the result of a Hot Spot analysis following an Ordinary Least Squares analysis. The red dots indicate areas where more WST artifacts are occurring than would be expected. I found it encouraging that my field work is occurring near the red dots in the western-most portion of Map 12.
 |
| Map 12 |
Overall this was a pretty intense final lab. It was a lot of work, but I think the results are useful or will be useful with some further refining. I am optimistic that we may find some interesting patterns regarding where Western Stemmed Tradition people congregated on the landscape and this may be useful as part of the pursuit for determining who was first in the Americas.


No comments:
Post a Comment