This week's assignment was pretty interesting and one that should be pretty useful for anyone working in a region that has had a lot of fieldwork in previous decades, specifically prior to computerization of records. The general idea was using older documents from a Valley of Oaxaca (Mexico) survey, digitizing and geoprocessing those maps onto an ArcGIS basemap, digitizing various aspects of the maps (sites and land use) and then using data from the original surveys to do analysis. The first map (above) shows my three assigned grid (N6 E4, N6 E5, and N6 E6) geoprocessed onto a digital topographic map and also the larger Valley of Oaxaca survey area.
The biggest challenge was getting the larger
survey map geoprocessed onto the base map.
My original base map selection contained far too many political objects
and the topographic features were hard to see and match up with the survey area
scan. I did find a base map that seemed
to have fewer objects cluttering the topography although it would be nice to
fine a base map that was just topographical without towns, roads, etc. Once the main survey scan was in place, it
was relatively simple matter to geolocate the assigned grids. The corners matched up quickly and easily and
there seemed to be good correspondence, particularly with the soil type maps.
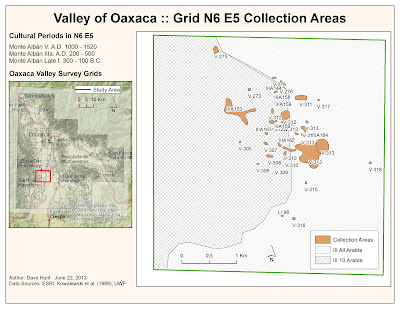
The second part of the lab involved creating an individual map for each of our assigned grids (below). For these maps, we digitized the site collection areas as polygons and captured the cultural period data from field notes.
The biggest challenge was initially
understanding the original drawings.
However, once I entered “field note-taker” mode, it was pretty easy to
understand how they were labeling each collection area. Creating the collection area polygons
progressed fairly quickly though there were some annoyances with polygons
closing themselves too early and the stop/edit attribute table/delete bad
polygon/start editing again process. I
used label classes to deal with the multiple cultural periods per collection
area. Some areas are quite crowded and
therefore clutters. Overall, I was
pretty happy with the end result.
Finally, the grad students continued on to join some additional site data to the existing digitized collections for a specific cultural period. I didn’t have any IIIB artifacts in my three
assigned grids, so I used IIIA (of which I had a lot) to demonstrate the join
to the additional data table. The join
was quite straightforward and after segregating IIIA collection polygons to
their own layer, I simply adjusted the symbology to use the joined lopop field
and appropriately color grade the sites based on their estimated low
populations.


Impressive. And that's an astounding amount of data you'll end up with in the long run. Pretty significant data, too; hope you've got fail safes and security backups for that.
ReplyDeleteWilliamsDataManagement.com